Plotting data
Often we want to plot loss or accuracy of a network training over time to get an impression of convergence speed. nuts-ml provides a simple plotting nut to facilitate this need. The following code example demonstrates the basic usage by plotting a squared numbers
>>> samples = (x**2 for x in range(100))
>>> samples >> PlotLines(None) >> Consume()
and here the output plot:
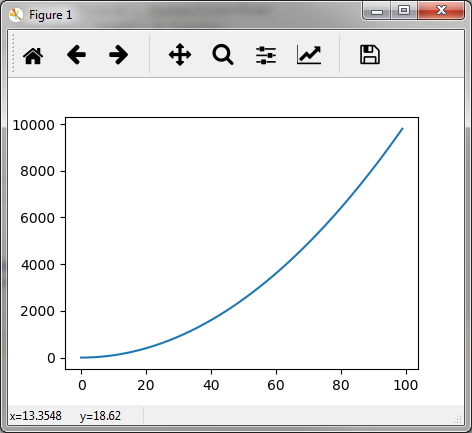
Note that the plot updates live with each sample read from samples and closes
immediately once the plotting is finished. Since the samples are just numbers
(and not tuples) we specify None as column index in PlotLines.
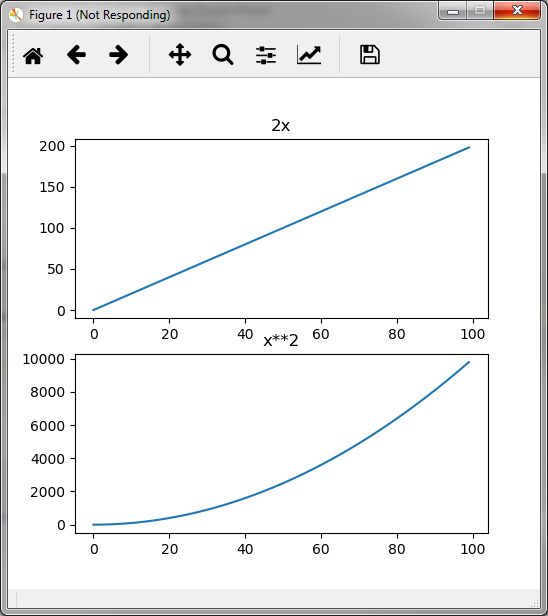
PlotLines allows to plot multiple sample columns. In this next example we
plot 2*x and x**2 and specify the corresponding sample columns
(0,1) in PlotLines:
>>> samples = ((2*x, x**2) for x in range(100))
>>> samples >> PlotLines((0,1), layout=(2,1), titles=('2x','x**2')) >> Consume()
We want the two plots of the figure to appear in one column
(instead of next to each other) and therefore set the layout
to 2 rows and 1 column. titles allows to set titles for the individual plots.
Let us conclude this section with a more realistic example. The following code sketch plots the loss and accuracy of a network training per batch and per epoch. The generated figures are written to image files in PNG format instead of being displayed:
plot_batch = PlotLines((0,1), every_sec=5, filepath='batch.png')
plot_epoch = PlotLines((1,2), 0, layout=(2,1), filepath='epoch.png')
mean = Mean()

for epoch in range(EPOCHS):
    t_loss, t_acc = (train_samples >> ... >> build_batch >>
                     network.train() >> plot_batch >> Unzip())
    plot_epoch( (epoch, mean(t_loss), mean(t_acc) )
For a large train set many batches will be created and losses computed.
We are only interested in a subset of those and set every_sec=5
to plot batch-wise loss and accuracy every 5 seconds. Alternatively
we could specify every_n=10 to plot for every 10-th batch.
When plotting the mean loss and average per epoch via plot_epoch
we provide a tuple of format (<epoch>, <mean loss>, <mean acc>).
We want the x-axis to show the epoch and the y-axes to show loss
and accuracy. The column indices specified in PlotLines
for the y-axes are therefore (1,2) and the values for the x-axis
are in column 0 of the samples. Run help(PlotLines) for more
details and the description of other parameters.